Podcast Center
 Video Center
 Webcasts
 Resource Center
 Events


 By
By  April 24, 2020 at 05:05 PM


The latest government COVID-19 pandemic report shows that new activity for COVID-19 and look-alike illnesses continued to slow during the week ending April 18, but that those illnesses still accounted for an extremely high percentage of all reported deaths.
Resources
- The CDC’s weekly COVID-19 report is available here.
- The CDC’s provisional COVID-19 mortality data table is available here.
- An article about the previously weekly COVID-19 report is available here.
Because tests for COVID-19 are still hard to get, and because most mildly symptomatic cases of COVID-19 look roughly like the flu, or like cases of ordinary viral pneumonia caused by viruses other than the flu, the U.S. Centers for Disease Control and Prevention (CDC) supplements the COVID-19 data in the weekly pandemic reports with data for pneumonia and “influenza-like illnesses.”
To deal with the possibility that some new, unknown or unnoticed illness could be causing problems, the CDC also includes the same kind of data on “influenza and influenza-like illnesses” in its weekly flu reports, along with data on the total number of deaths from all causes.
The numbers for the latest two or three weeks are usually incomplete, because some states take longer to send their data to the CDC than others.
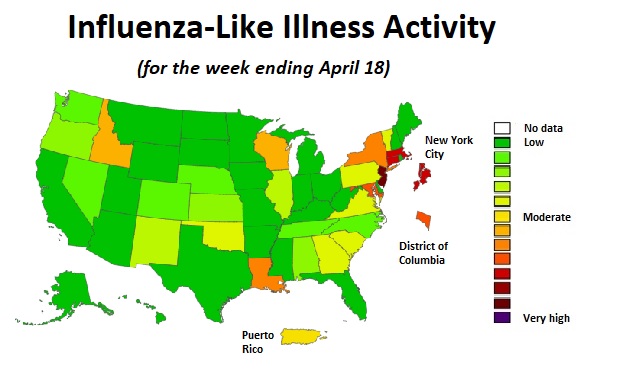
The latest COVID-19 report includes an influenza-like illness activity map showing that most of the United States has low or minimal levels of influenza-like, and that most states with changing activity levels are moving toward having lower illness activity levels.
Much more of the activity appears to be due to COVID-19 than to true influenza, becauses, since the week ending March 7, the CDC has recorded 24,550 laboratory-confirmed cases of COVID-19, and just 2,971 laboratory-confirmed cases of the flu.
New Jersey continues to have extremely high activity levels, Wisconsin continues to have moderately high levels of activity, and Idaho has moved from having a moderate level of activity to having a somewhat higher level of activity.
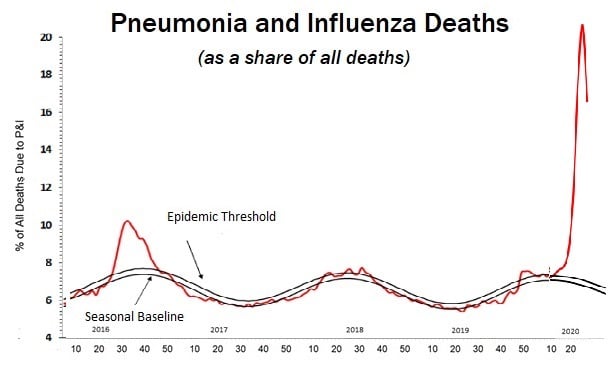
The death numbers, which typically reflect the results of illnesses that started two to four weeks in the past, tell a different story.
They show that deaths recorded as being caused by COVID-19, other flu-like illnesses and pneumonia amounted to about 22% of all U.S. deaths in the week ending April 11, which is four times the usual level, is higher than the CDC has shown on charts going back to the early 1990s, and might be the highest since at least the 1968 flu pandemic.
For a map, a chart and state mortality figures based on the new COVID-19 report, see the slideshow above. (Wiggle your pointer over the first slide to make the control arrows show up.)
For the provisional state mortality data for the week ending April 18, see the table below.
*
| Jurisdiction of Occurrence | COVID-19 Deaths | Deaths from All Causes | Total Deaths As a Percent of Expected Deaths | COVID-19 Deaths As a Percent of Deaths From All Causes | All Pneumonia Deaths |
|---|---|---|---|---|---|
| United States | 24,555 | 654,798 | 96 | 3.75% | 54,962 |
| Alabama | 113 | 11,553 | 90 | 0.98% | 714 |
| Alaska | - | 789 | 78 | NA | 37 |
| Arizona | 156 | 14,756 | 101 | 1.06% | 1,034 |
| Arkansas | 19 | 7,245 | 94 | 0.26% | 485 |
| California | 813 | 64,633 | 97 | 1.26% | 5,437 |
| Colorado | 392 | 9,936 | 103 | 3.95% | 838 |
| Connecticut | - | 461 | 0 | NA | 29 |
| Delaware | 28 | 1,939 | 77 | 1.44% | 108 |
| District of Columbia | 44 | 1,331 | 89 | 3.31% | 146 |
| Florida | 674 | 50,784 | 99 | 1.33% | 3,640 |
| Georgia | 335 | 18,158 | 88 | 1.84% | 1,167 |
| Hawaii | - | 2,656 | 92 | NA | 182 |
| Idaho | 38 | 3,393 | 97 | 1.12% | 185 |
| Illinois | 748 | 26,345 | 103 | 2.84% | 2,269 |
| Indiana | 238 | 15,292 | 92 | 1.56% | 1,299 |
| Iowa | 48 | 6,906 | 94 | 0.70% | 493 |
| Kansas | 39 | 6,041 | 92 | 0.65% | 407 |
| Kentucky | 70 | 9,957 | 84 | 0.70% | 885 |
| Louisiana | 538 | 10,099 | 91 | 5.33% | 668 |
| Maine | 26 | 3,562 | 99 | 0.73% | 302 |
| Maryland | 444 | 12,494 | 102 | 3.55% | 1,100 |
| Massachusetts | 1,016 | 15,550 | 105 | 6.53% | 1,638 |
| Michigan | 1,264 | 24,499 | 103 | 5.16% | 2,188 |
| Minnesota | 100 | 10,496 | 99 | 0.95% | 762 |
| Mississippi | 117 | 7,408 | 97 | 1.58% | 644 |
| Missouri | 117 | 14,006 | 89 | 0.84% | 878 |
| Montana | - | 2,248 | 90 | NA | 132 |
| Nebraska | 21 | 3,696 | 90 | 0.57% | 285 |
| Nevada | 99 | 6,003 | 95 | 1.65% | 484 |
| New Hampshire | 42 | 2,974 | 99 | 1.41% | 203 |
| New Jersey | 3,018 | 22,310 | 123 | 13.53% | 3,031 |
| New Mexico | 28 | 4,003 | 85 | 0.70% | 281 |
| New York | 3,567 | 28,773 | 118 | 12.40% | 4,246 |
| New York City | 8,073 | 25,978 | 198 | 31.08% | 4,741 |
| North Carolina | 0 | 9,131 | 38 | 0.00% | 557 |
| North Dakota | - | 1,504 | 86 | NA | 135 |
| Ohio | 168 | 24,258 | 80 | 0.69% | 1,382 |
| Oklahoma | 74 | 8,163 | 83 | 0.91% | 717 |
| Oregon | 58 | 7,804 | 88 | 0.74% | 417 |
| Pennsylvania | 690 | 25,641 | 77 | 2.69% | 1,794 |
| Rhode Island | 31 | 2,075 | 80 | 1.49% | 108 |
| South Carolina | 103 | 12,063 | 100 | 0.85% | 720 |
| South Dakota | - | 1,814 | 90 | NA | 143 |
| Tennessee | 107 | 17,104 | 95 | 0.63% | 1,289 |
| Texas | 256 | 44,867 | 92 | 0.57% | 3,274 |
| Utah | 18 | 4,427 | 93 | 0.41% | 262 |
| Vermont | 35 | 1,461 | 101 | 2.40% | 99 |
| Virginia | 131 | 16,252 | 97 | 0.81% | 864 |
| Washington | 463 | 13,384 | 97 | 3.46% | 1,109 |
| West Virginia | - | 4,647 | 84 | NA | 332 |
| Wisconsin | 159 | 12,869 | 100 | 1.24% | 739 |
| Wyoming | - | 1,060 | 97 | NA | 83 |
| Puerto Rico | 52 | 4,732 | 68 | 1.10% | 664 |
| The CDC notes that there is often a lag in reporting deaths and putting them in the mortality data, and that it leaves out the information when a cell would contain a number lower than 10. The “percent of expected deaths” column reflects the number of all deaths reported for the week ending April 18 when compared with the average for the comparable week of the year in 2017, 2018 and 2019. | |||||
.
— Read What If COVID-19 Lowers Health Claims?, on ThinkAdvisor.
— Connect with ThinkAdvisor Life/Health on Facebook, LinkedIn and Twitter.


 Slideshow